Key Reports
This section covers key reports.
Depending on the specific customer, the following key reports are available:
KPI Dashboard allows the user to generate a KPI report for a selected concept between two selected dates.
KPI Dashboard (single site) allows the user to generate a KPI report (including Late Items by Volume and Top
Selling Items) for a selected single site between two selected dates.
Late Items by Volume lists late item percentages and volume as a bubble grid by hour by day for a seven day period
by concept and site.
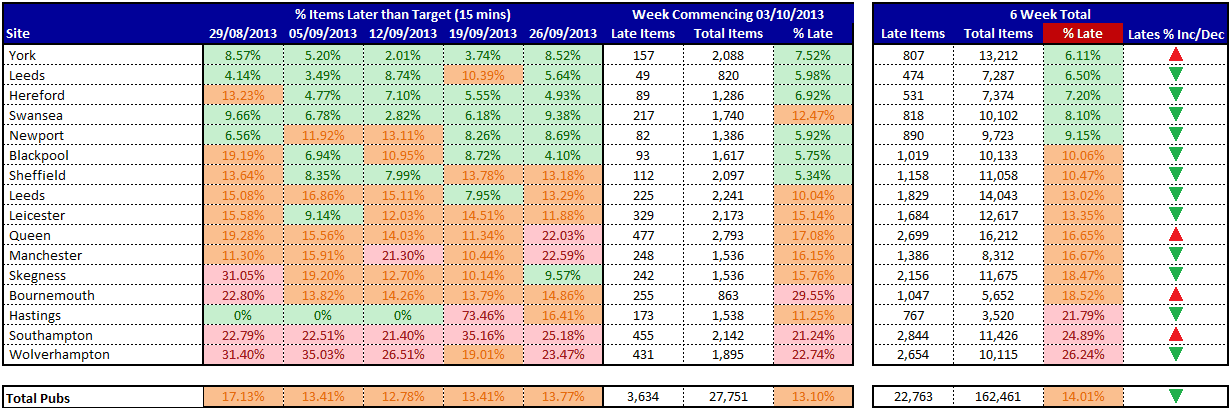
Late Items Statistics lists late item statistics for a four or six week period by concept and site.
Select the required customer and report name from the dropdown lists.
Selection of one or more concepts and sites is report dependant from dropdown lists or selection lists.
All reports will be emailed to the designated recipient and by default is that of the current user. Recipients can be
delimited with semi-colons.
NOTE: Not all reports are available for all customers and some reports have a different set of banding parameters
depending on the customer.

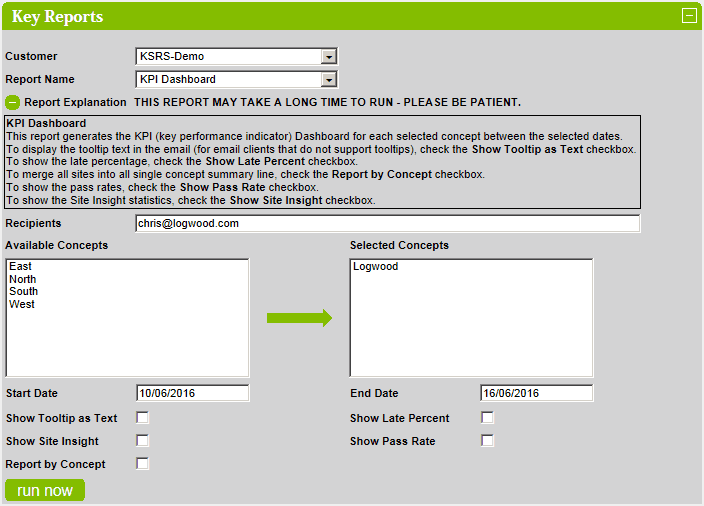
KPI Dashboard
By default, the report explanation is not displayed.
To view the report explanation, click on the  button.
To remove the report explanation, click on the  button.
Click on a concept in the Available Concepts list to add it to the Selected Concepts list.
Click on a concept in the Selected Concepts list to remove it.
The report places detailed timings and counts into the tooltip but some email clients don't support this.
To display the results in the report, check the Show Tooltip as Text checkbox.
To show the percentage of late orders in the late orders column in the
report, check the Show Pass Rate checkbox.
To combine individual site totals into one line for each concept, check the Report by Concept checkbox.
To show the pass rate column in the report, check the Show Pass Rate checkbox. The pass rate column displays how
many of the KPI's have passed on a site by site basis.
To show the Site Insight statistics, check the Show Site Insight checkbox.
Click on the run now button to run the report.
If selected concept has no KPI's defined then the following error message is displayed:

Example Report

KPI Dashboard (single site)
By default, the report explanation is not displayed.
To view the report explanation, click on the button.
To remove the report explanation, click on the button.
Select the required concept and site from the dropdown lists.
The report places detailed timings and counts into the tooltip but some email clients don't support this.
To display the results in the report, check the Show Tooltip as Text checkbox.
To show the percentage of late orders in the late orders column in the report, check the Show Pass Rate checkbox.
To send this email to each site, check the Send Site Email to Site checkbox.
To show the pass rate column in the report, check the Show Pass Rate checkbox. The pass rate column displays
how many of the KPI's have passed on a site by site basis.
To show the Site Insight statistics, check the Show Site Insight checkbox.
Click on the run now button to run the report.

Example Report

Late Items by Volume
By default, the report explanation is not displayed.
To view the report explanation, click on the button.
To remove the report explanation, click on the button.
Click on a concept in the Available Concepts list to add it to the Selected Concepts list.
Click on a concept in the Selected Concepts list to remove it.
To output the report to an attached PDF, check the Create PDF checkbox.
To view the report with sites merged into a single grid by concept, check the Report as Single Concept checkbox.
To show the Site Insight statistics, check the Show Site Insight checkbox.
To show the number of items and late percentages, check the Show Late Items Percentages checkbox.
To run the report for a single site, check the Single Site Only checkbox.
To run the report for a single day, check the Single Day Only checkbox.
When checked, this is option will force Show Late Items Percentages and will not display the coloured circles.
By default, this report will run for Starters and Mains. To change the courses selection, check the required
Course: checkboxes.
Click on the run now button to run the report.

Example Report

Late Items Statistics
By default, the report explanation is not displayed.
To view the report explanation, click on the button.
To remove the report explanation, click on the button.
Click on a concept in the Available Concepts list to add it to the Selected Concepts list.
Click on a concept in the Selected Concepts list to remove it.
By default, Report Weeks: 6 is checked and the report shows the percentage of late items for the previous five weeks
from the selected Start Date and the number of late items, total number of items and the percentage of late items for
seven days from the selected Start Date.
When Report Weeks: 2 is checked then the report is the same apart from it runs for a two week period only.
When Report Weeks: 4 checked then the report shows the percentage of late items for four weeks
starting from the selected Start Date and the number of late items, total number of items and the percentage of late
items for four weeks from the selected Start Date and the number of late items, total number of items and the
percentage of late items for seven days from the selected Start Date.
The report runs for 6 weeks from the entered Start Date - to change the number of weeks, select a different value from
the Report Weeks spinner.
Check the Show Site Count checkbox to show the number of sites per concept count on the summary page.
When the Extended Report checkbox is checked then this report also shows the Average Wait Times for the six week
period and the percentage of late orders above the Secondary Late Band minutes.
Click on the run now button to run the report.

Example Report
Detail Tab
Summary Tab
